In the most recent post about Lone Tree Farm, we looked at archaeological features that were circles and lines that could be seen on aerial photos, geophysical maps, and LiDAR images. This current post will extend that discussion to linear archaeological features at Blood Run National Historic Landmark (NHL) located about 30 miles east of the Farm. You’ll maybe recall that archaeological features are basically concentrations of small artifacts and that features themselves are in turn organized into larger archaeological sites. So, we’ll basically be describing the “middle-sized” elements of the artifact-feature-site archaeological scale spectrum. But in addition, we’re going to look at linear features in the landscape at Blood Run and show how they’re related to the linear archaeological features.
One of my first posts about Blood Run archaeology identified “neighborhoods” at the Blood Run NHL. These are basically groups of circular mounds that hosted concentrations of artifacts found on the surface of a plowed agricultural field. That story was based on work by professional archaeologists done in the 1980s and reported in publications in the early 2000s. Since that time there’s been only a minimal amount of new data collected at Blood Run. The Iowa Office of the State Archaeologist (OSA) did recently do some coring in preparation for restoration activities at the Sacred Spring and this past year a series of shovel tests were carried out near the location of a planned creek crossing. But, these were pretty small, mission-specific studies. In contrast, the OSA has done extensive LiDAR mapping of the NHL and surrounding areas that’s been described in a Technical Report in 2021. You might remember from the Farm post that LiDAR uses airborne laser surveying to produce very detailed topographic maps.
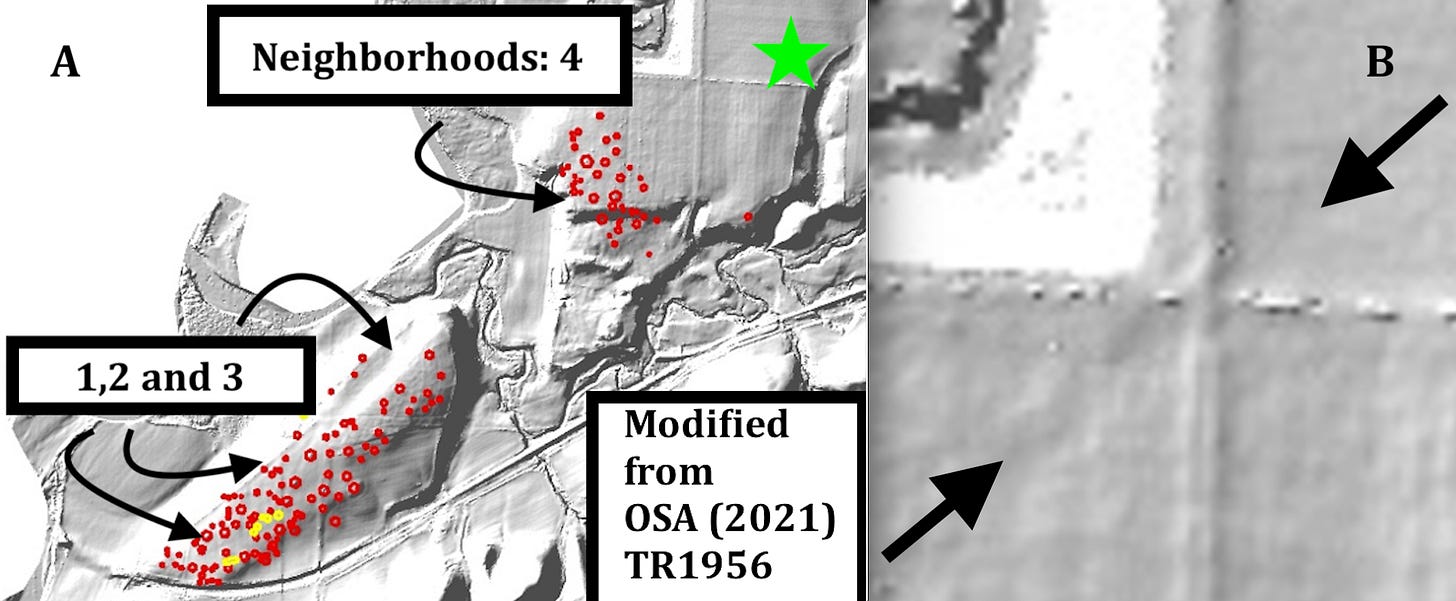
Figure 1. LiDAR images showing landscape at Blood Run. A) The main mound groups. B) Close-up of a northeast-trending linear feature.
A common way to display the detailed elevation information from LiDAR is to digitally produce an image called a “hillshade rendition”. That computer-generated image looks like the terrain would appear if the high and low areas cast shadows from a low-angle light source. Figure 1-A has an illumination source from the south and east so the slopes that are most clearly emphasized in the light and dark patterns, are mainly those trending northeast. Individual mounds are marked by red circles and the clusters that define neighborhoods are shown by the black arrows and labels. The natural terrain can be seen as fairly prominent hills and valleys as well as the distinct stream channel.
There is, however, one very subtle linear feature located near the green star. That subtle linear topographic feature shown in closer detail in Figure1-B, trends to the northeast at N 50 E and is less than 1,000 feet long. It has an expression that is similar to a line observed at the Bridge Site on the Farm where detailed contour mapping showed that it was a distinct, though subtle, topographic feature that also had expression in soil magnetic properties. Detailed topographic contours showed that the LiDAR line at the Farm was a series of small-scale depressions that corresponded with aligned magnetic anomalies. There’s no magnetic mapping available at Blood Run, but we do have some new detailed topographic contouring based on LiDAR.
Figure 2. Detailed topographic contours based on LiDAR data.
Several years ago, I asked a friend who routinely works with Geographic Information Systems (GIS) to map a part of the Blood Run NHL using LiDAR data that’s available to the public. The resulting detailed topographic contour map (Figure 2) basically covers the upland surface where the subtle linear feature is located and the adjacent Neighborhood 4 which is the northern-most mound group (see Figure 1A). The contour lines in Figure 2 show vertical elevation differences of .1 feet and the subtle highs and lows labeled with H and L are not easy to see on the ground. Those blue features on the east side of the map have been suggested to be garden plots or possibly burrow pits for the material used to build the mounds. The two elongate lows in the northeast corner are the expression of the subtle northeast linear feature on the hillshade image. That’s similar to what we saw at the Bridge Site on the Farm.
The mounds in Neighborhood 4 on the west side of the map are labeled in yellow; the numbers refer to the surviving mounds that are part of an earlier numbering system. Two parallel dashed lines show the overall trend of the mound group to the southeast. So, these circular features are arranged a way that defines a linear feature. That pattern will be shown in more detail in the next figure. The Sacred Spring located down-slope to the west of the mound group is a significant landmark that will be shown to be part of another linear feature that trends northeast.
Figure 3. Linear patterns in Neighborhood 4. A) Overall trends of mounds and cache pits. B) Pattern of artifacts in cache pits at the southeast end of the mound group.
In the 1980s the mounds were surveyed and mapped as a part of salvage efforts on the advancing edge of a gravel pit (Figure 3-A). The dates on the lines in the lower right demonstrate the threat posed by the shifting pit edge. Mounds are shown as large green circles. The salvage excavations focused mainly on small, circular pits used for storage and/or trash. These are shown as small circles in Figure 3-A that define a line trending to the northeast. Again, the arrangement of the circular features defines a distinct linear trend. In contrast, the zone of mounds trends to the southeast.
Figure 3-B is a close-up that summarizes the number of artifacts found in each of the small, circular pits. The contours show overall trends to the southeast and northeast, similar to the trends observed in the larger mounds. So, both small and large circular features are aligned to define southeast and northeast trends. Similar arrangements are found in the mound neighborhoods to the south across Blood Run Creek.
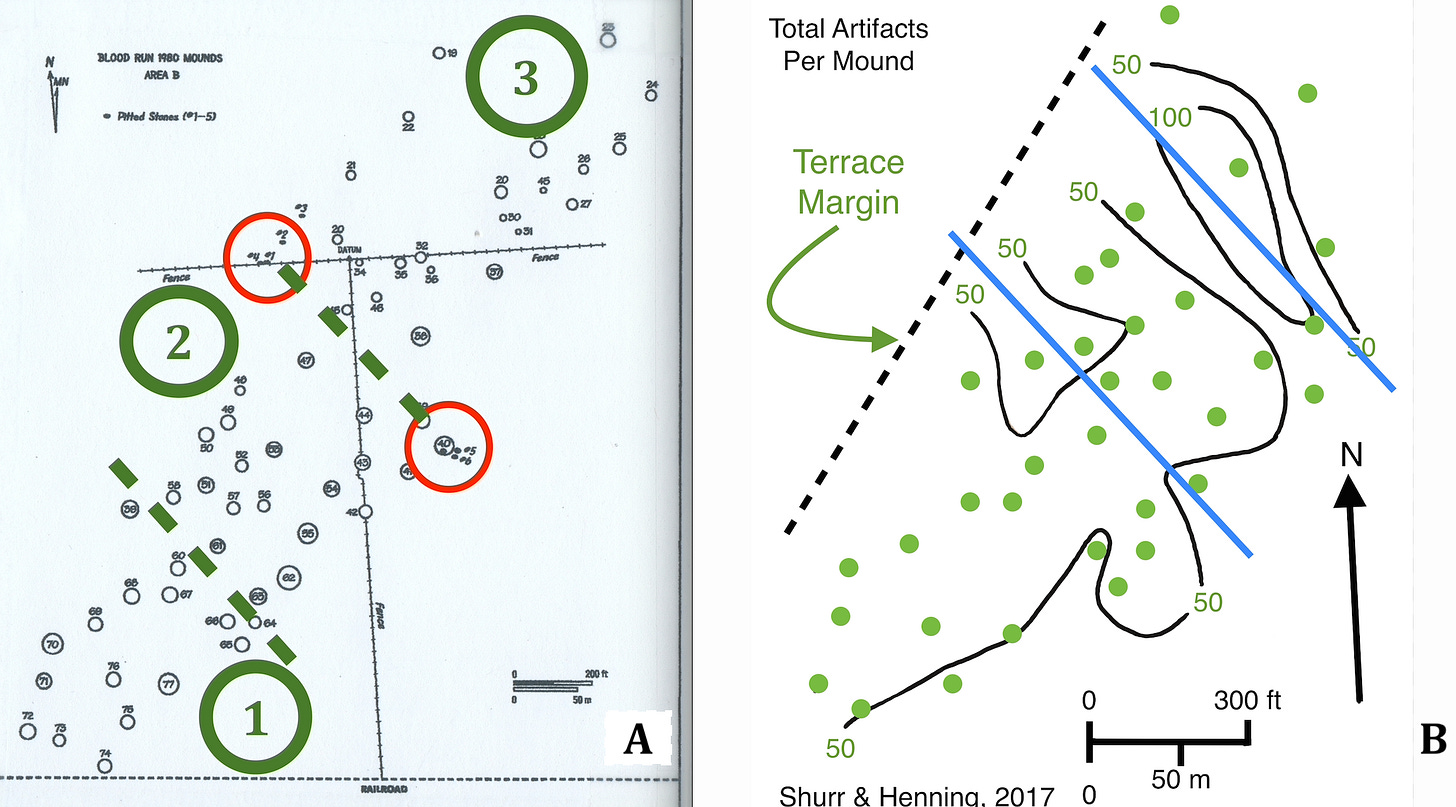
Figure 4. Mounds and artifacts in Neighborhoods 1,2, and 3. A) Mound distribution defines neighborhoods. B) Pattern of artifacts in Neighborhoods 1 and 2.
Patterns in the mounds and artifact distributions in the neighborhoods south of Blood Run Creek also define linear features that trend to the southeast and to the northeast. The total cluster of mounds in Neighborhoods 1,2, and 3 (Figure 4-A) shows an overall elongation pointing northeast because that’s the general trend of the terrace that they’re built on. In addition, lines that separate individual neighborhoods trend to the southeast. The line between Neighborhoods 2 and 3 is anchored by the iconic Pitted Boulder on the northwest end and by a pile of small pitted boulders on the southeast end shown by red circles.
The separation of Neighborhoods 1 and 2 is not easily seen in patterns of artifact distribution (Figure 4-B). But, the contours summarizing the number of artifacts collected from plowed-down mounds clearly trend to the southeast at approximately right angles to the edge of the terrace. Again, the mapped pattern of small artifacts found within the larger mound features demonstrate linear trends to the southeast.
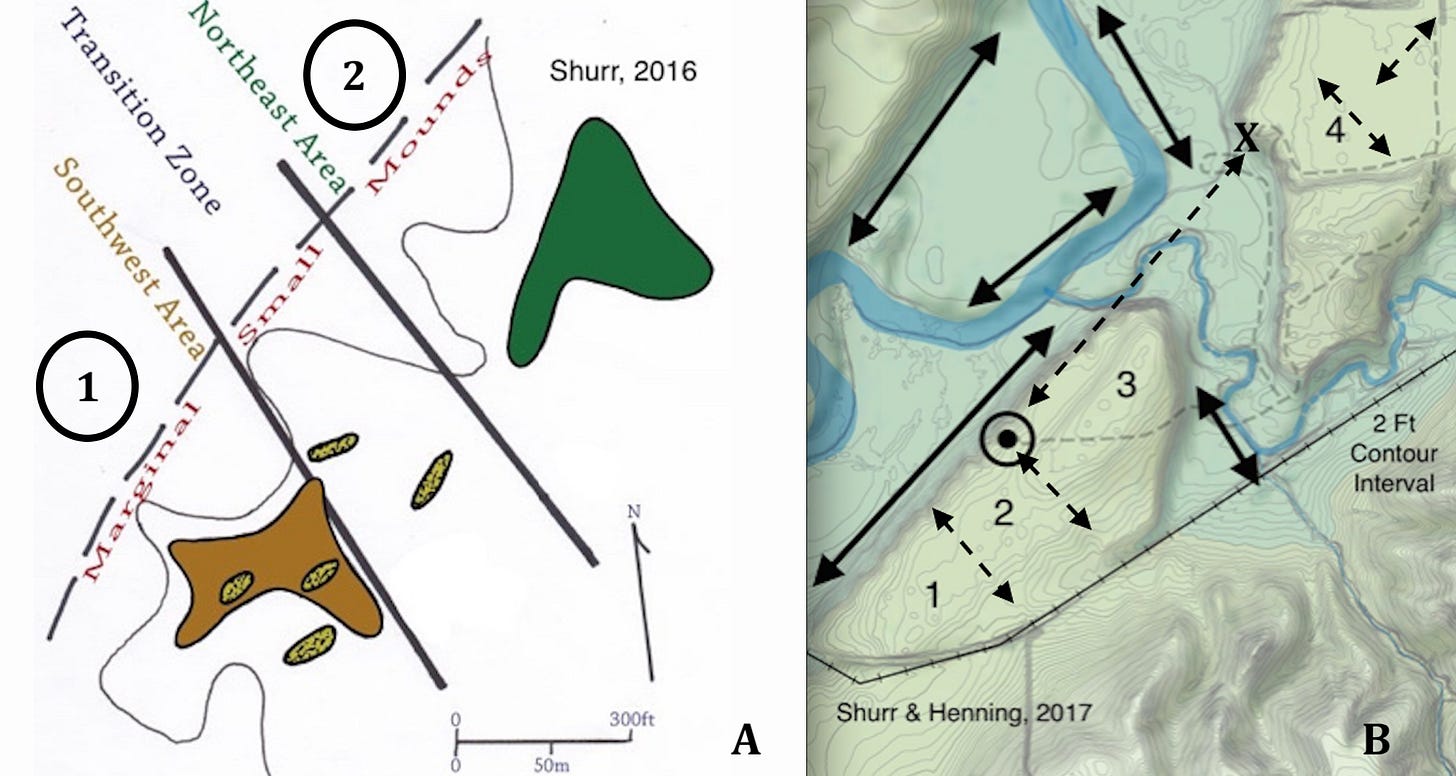
Figure 5. A) Summary of mounds in Neighborhoods 1 and 2. B) Linear landscape elements and linear archaeological trends in the Blood Run NHL.
Neighborhoods 1 and 2 can also be distinguished on the basis of mound size and erosion rates (Figure 5-A). The larger mounds in Neighborhood 1 (i.e., the Southwest Area) are located within the brown “blob” and have a low rate of erosion. The larger mounds in Neighborhood 2 (i.e., Northeast Area) are in the green “blob” and have a higher rate of erosion. Small mounds were located along the terrace margin that trends to the northeast, but most of these small mounds have been totally eroded away. Elongate outlines of boulders trending northeast are shown as cigar-shaped tan features in the Southwest Area and the Transition Zone. The Transition Zone itself trends to the southeast.
Zooming out to get a larger view (Figure 5-B), the margin of the terrace where the three neighborhoods are located has a clear orientation toward the northeast. In addition, the linear western wall of the river valley and one straight stretch of the channel trend to the northeast. There are also two straight channel segments that have a southeast orientation. All of these landscape features are marked with solid double-headed black arrows. Linear archaeological features that we’ve already described are shown by dashed doubled-headed black arrows. The pitted boulder at the circled dot and the Sacred Spring at the “X” are archaeological landmarks that define a line extending to the northeast.
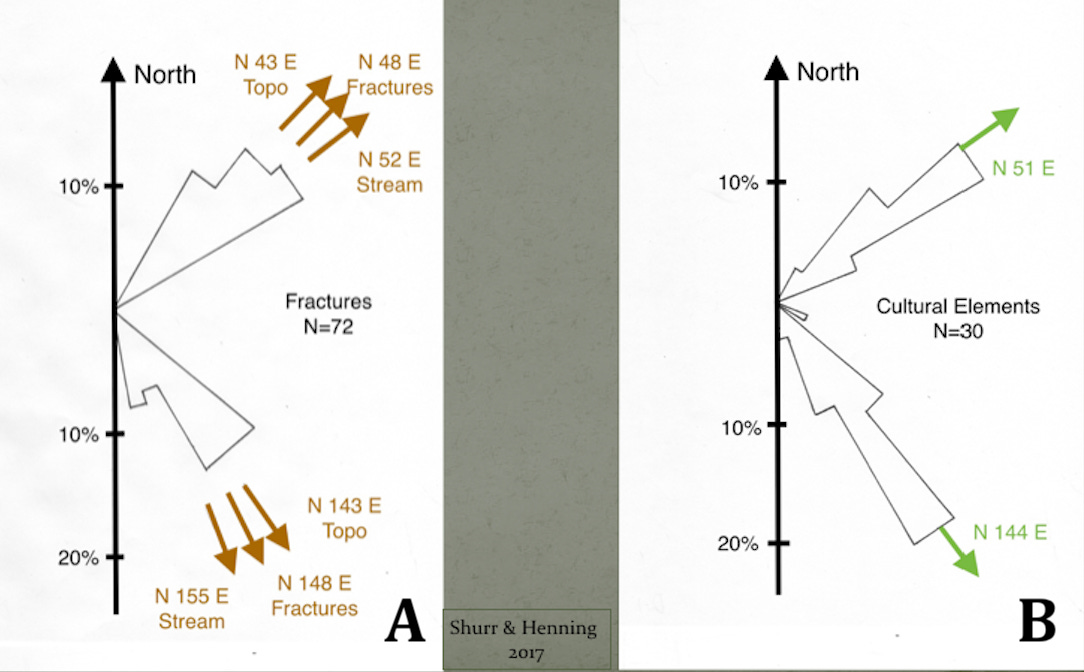
Figure 6. A) Summary of linear geologic features. B) Summary of linear archaeological features.
The straight stream segments and linear topographic components are believed to have been controlled by bedrock fractures in this area. The fractures can be directly measured in bedrock exposures at Gitchie Manitou State Preserve a few miles north of the Blood Run NHL. The trends for all of these geologic features are summarized in Figure 6-A. For comparison, there’s also a summary of the various linear archaeologic features at Blood Run in Figure 6-B. Both summaries include the examples that we’ve been looking at as well as other data. The overall message is that the linear archaeological features have about the same orientation as the linear geological features.
Figure 7. Summaries of linear features from around the region (Shurr, 2019). A) Geologic features. B) Archaeologic features.
The correspondence of linear geological and archaeological features is not just confined to Blood Run NHL. A review of twelve archaeological sites in northwestern Iowa, southwestern Minnesota, and eastern South Dakota shows a similar correspondence (Figure 7). Were the archeological sites purposely located in areas where the landscape displayed these trends to the southeast and northeast?
To add to the mystery, the southeastern trend generally points to the winter solstice sunrise position and the northeast trend points to the summer solstice sunrise position. So, there also seems to be an additional astronomical significance. Obviously, the people who lived and worked in these areas were astute observers of both the earth and sky. This is demonstrated in the patterns of their lifeways that are reflected in the archaeological record. Blood Run is one of those places where the archeology appears to mimic the geology and astronomy.
This has turned out to be a long read, so if you made it this far…. Thanks! Hopefully, this deep dive has convinced you that the Native Americans who lived here were very sophisticated observers of the natural world and that they built their lives around the intrinsic patterns that they saw in the earth and sky.


"Blood Run is one of those places where the archeology appears to mimic the geology and astronomy." I find this fascinating. I wonder if there is a world atlas of such places.