


Mapping Neighborhoods
Mound Patterns in the "Silent City"

This is the first of a series of posts that will focus on the “Silent City” located just east of Sioux Falls, SD, near Good Earth State Park. These “newsletters” will probably be sent out every other week or so. The first couple of these posts tend to be sorta long and full of “science”. But if you stick with it, the next two are more speculative and even fictionalized.
If this is the first time that you’ve read this “Rooted” blog, I invite you to check back in the archive to get some perspectives on the larger area that constitutes The Land at the Edge of the Sky.
About 500 years ago (1500s to 1700s) there were thriving neighborhoods spread out along both sides of the Big Sioux River in South Dakota and Iowa. The people who lived here were the ancestors of the modern Omaha, Ioway, Ponca, and Oto Native Americans. However, archaeologists apply the term “Oneota” to describe the cultural traditions shared by these modern tribal nations.
The name “Silent City” was first used in the 1890s to describe a cluster of earthworks and mounds located along Blood Run Creek on the Iowa side of the Big Sioux River. But, the total Oneota community was a complex series of village sites spread out along both sides of the Big Sioux River. Compared with other Oneota occupation areas in the Midwest, this community was much larger and unique because of the associated mound groups.
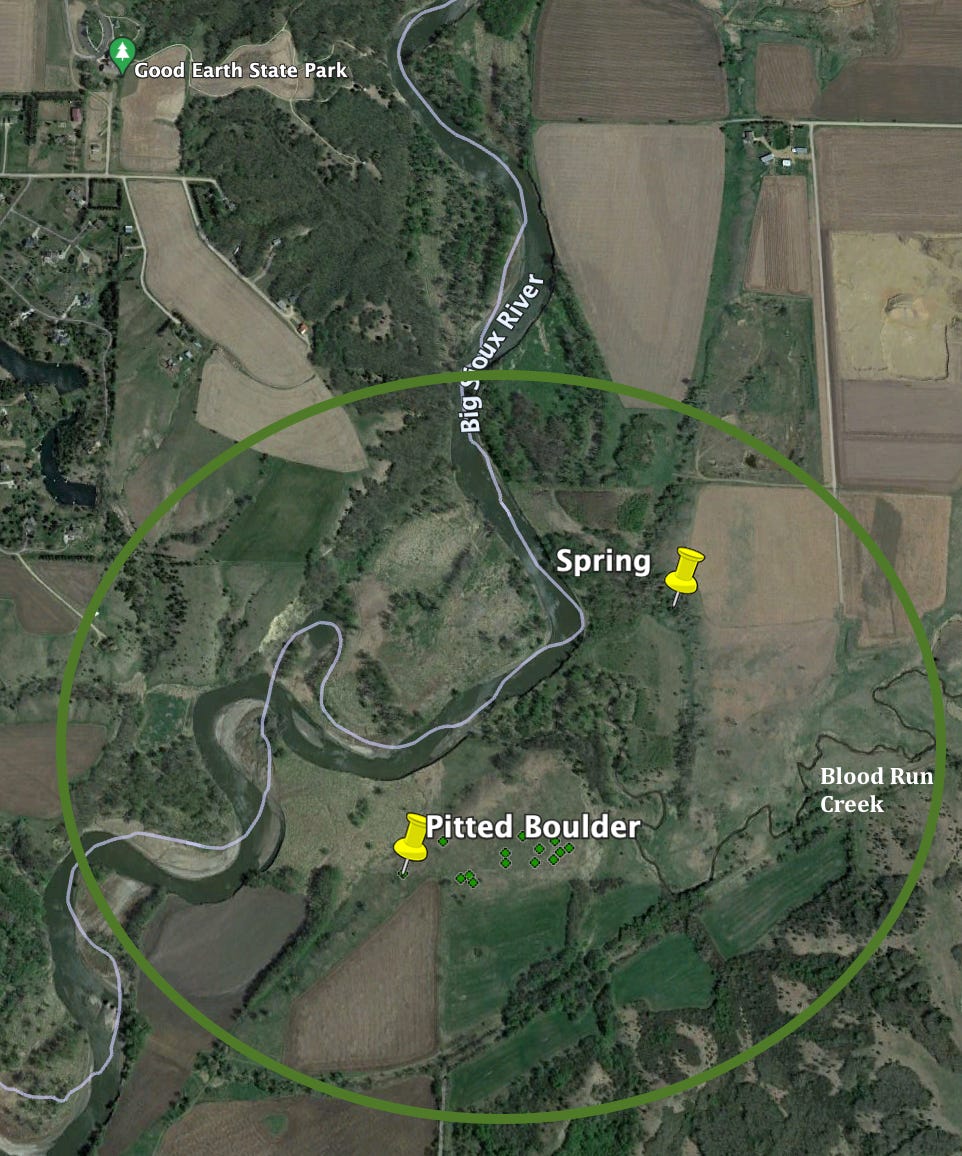
Figure 1. This screenshot from Google Earth shows the general area where detailed maps of the mound groups are available. The village complex along the Big Sioux River extends beyond Good Earth State Park to the north and also downstream south of the Pitted Boulder. The Pitted Boulder and the Spring are two distinctive landmarks within the main mound group.
A local resident interested in the archaeology at Blood Run, recently asked me about maps of the area. There are a lot available. Figure 1 is a contemporary view from space so specific archaeological features are hard to see at this scale. But there are more detailed maps dating back to the late1880s that are based on ground surveys. And, there are very recent maps that have been generated using new technologies.
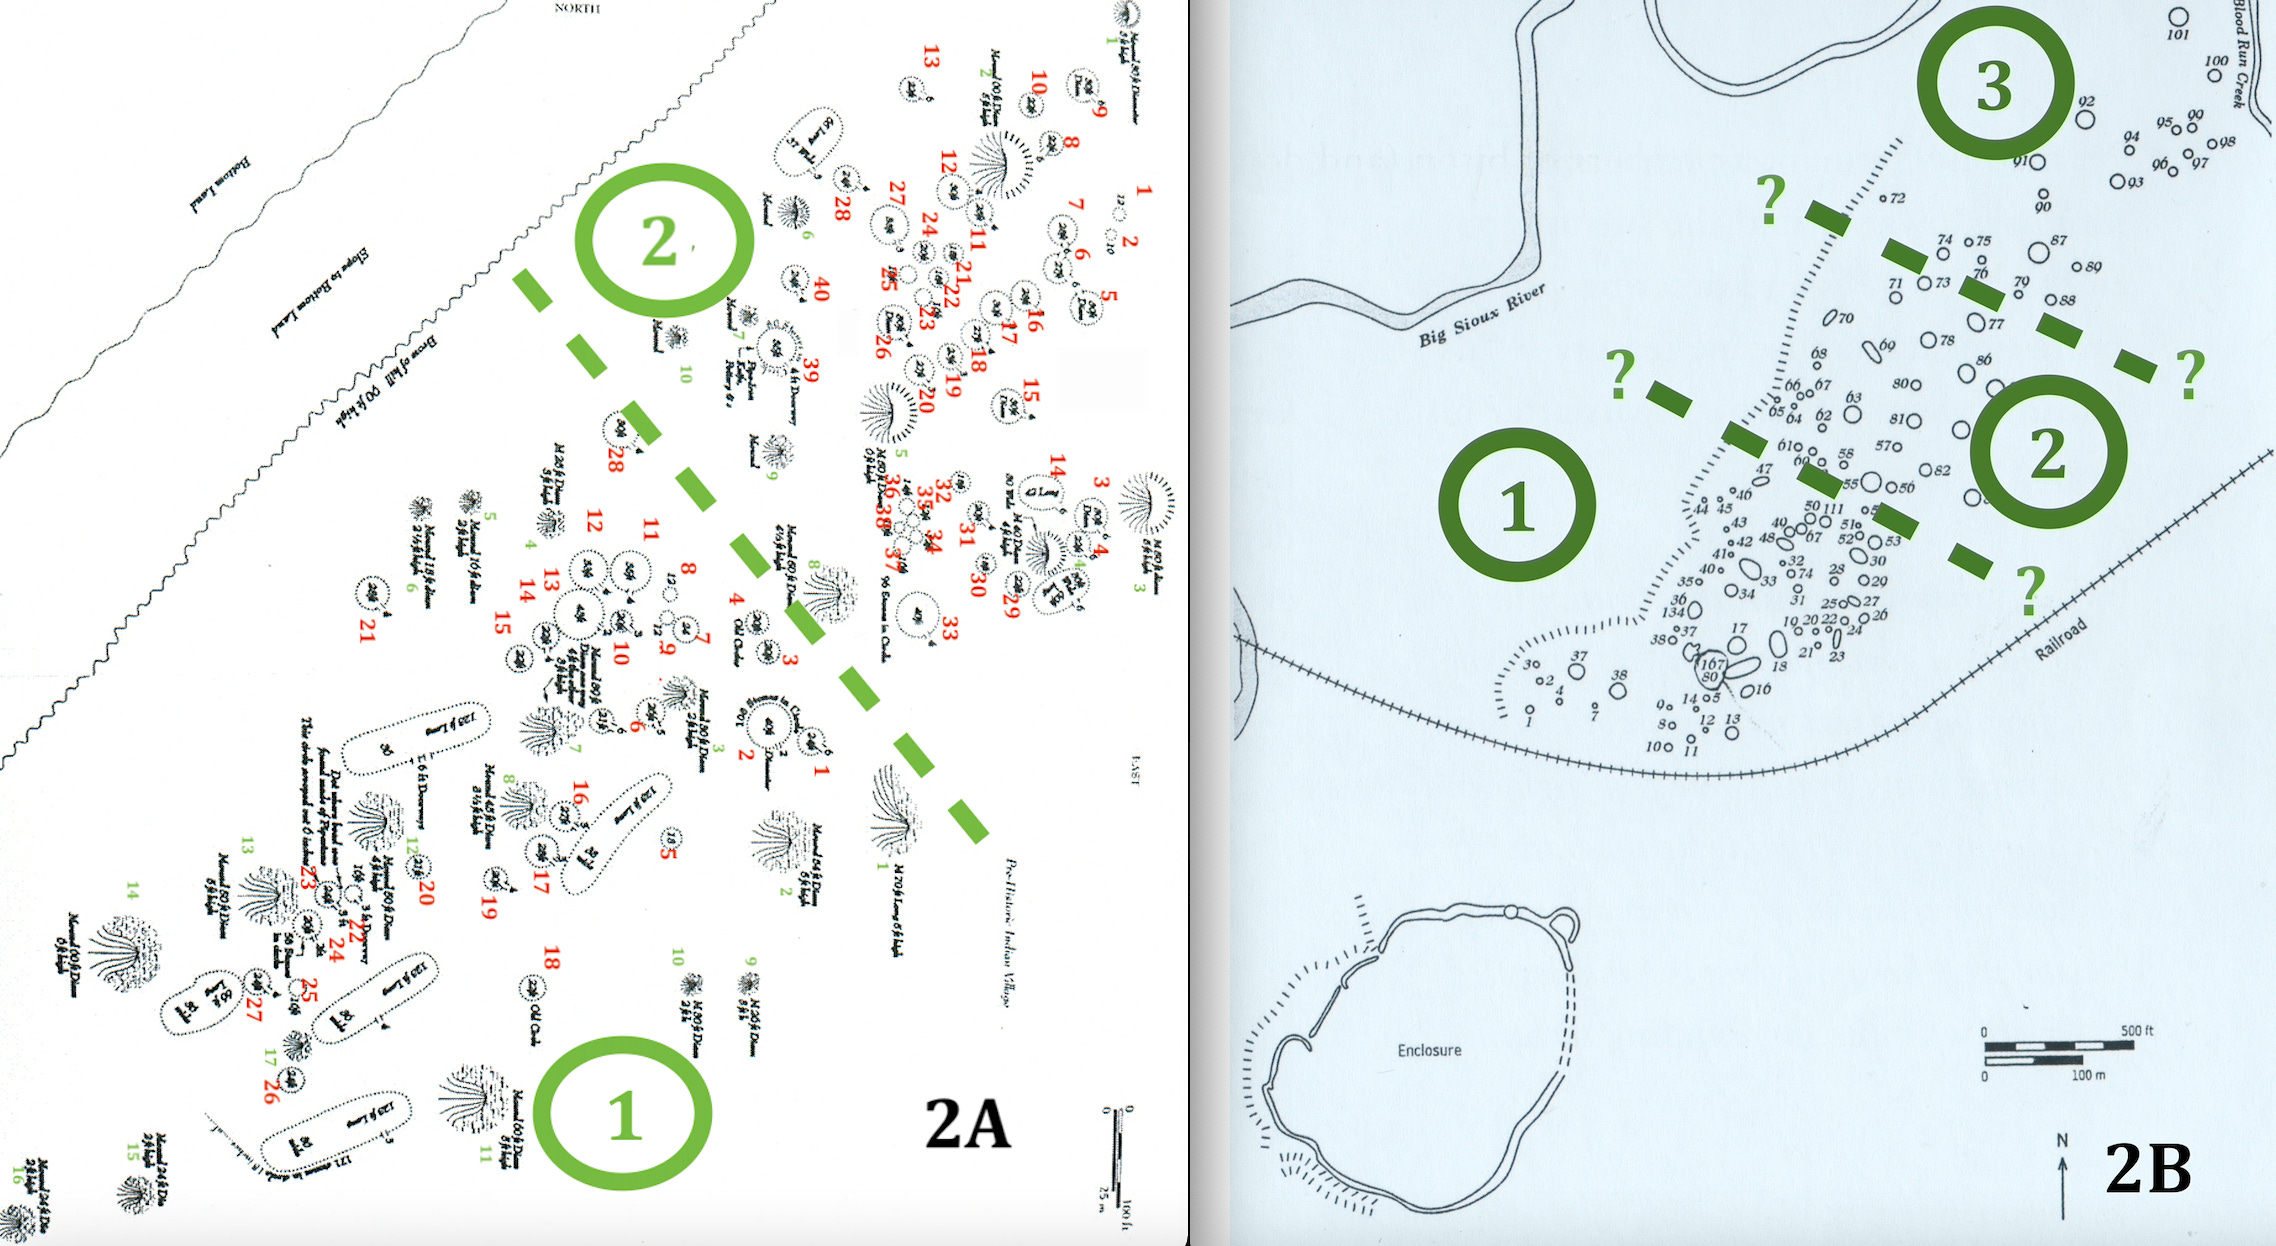
Figure 2. Historic maps of the main mound group at Blood Run with possible neighborhoods marked : A) Pettigrew, 1886, and B)Lewis,1889.
The map shown in Figure 2A was originally drawn by F.W. Pettigrew who first used the name “Silent City”. The image is rotated so that the edge of the stream terrace in the upper left is oriented to the northeast. That follows the convention of putting north at the top of the map and makes it easier to compare with other maps. The small green numbers mark a count of mounds and the red numbers count circles outlined by rocks. The large green numbers are areas with distinctive patterns and counts: Area 1 has 16 mounds and 28 rock circles and Area 2 has 10 mounds and 40 rock circles. In addition, Area 1 has 4 large and 1 small elongate rock outlines. The dashed green line divides the two areas that appear to have different patterns of mounds and rock circles. Maybe these two areas were two distinct neighborhoods?
The map in Figure 2B seems to have similar subdivisions just based on the distribution patterns of mounds. However, in addition to mapping mound locations, T. H. Lewis measured the height and diameter of the mounds. These measurements can be used to calculate mound sizes and there are distinct patterns in those numbers that reenforce the idea that Areas 1 and 2 represent two different neighborhoods. We’ll look at those patterns of mound size later in this post. In the meantime, using just the density of the mapped mounds as a guide, it appears that there’s a third neighborhood located along the flat terrace to the northeast of Areas 1 and 2.
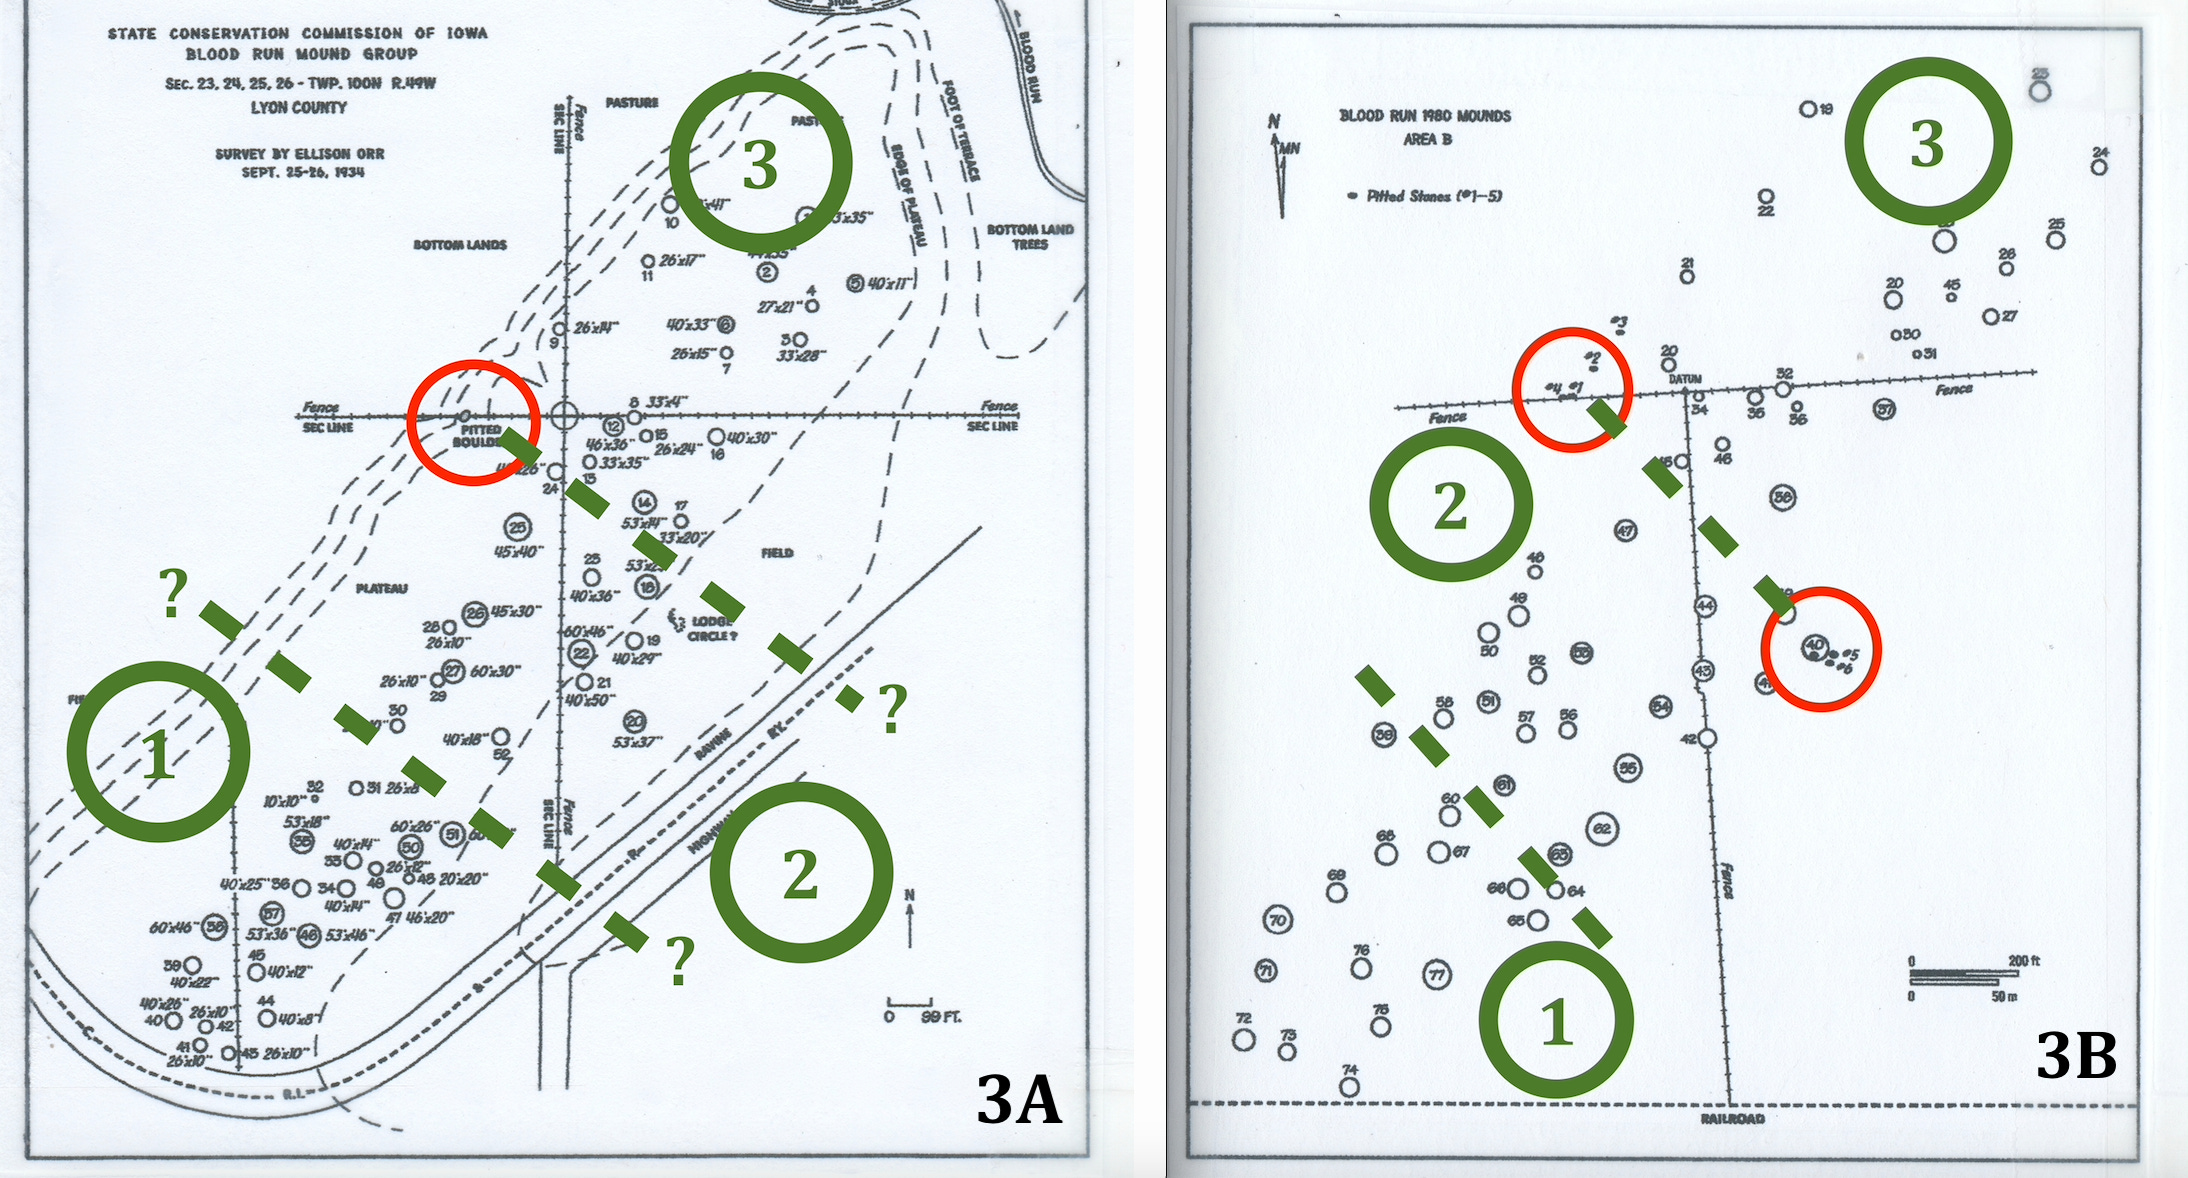
Figure 3. Possible neighborhoods marked on twentieth century maps of the main mound group at Blood Run : A) Orr, 1934, and B) Henning, 1982. Red circles show the locations of pitted boulders.
The three distinct areas that might represent separate neighborhoods also show up on maps produced in the twentieth century (Figure 3). Although there are fewer mounds preserved and visible for documentation than in the older maps, there do seem to be distinct patterns of distribution that give expression to the three neighborhoods. In addition, the locations of pitted boulders (we’ll describe these in a later post) provide another line of evidence for the boundary between Areas 2 and 3. The map in Figure 3A sketches the locations of the three neighborhoods on the landscape topography; the idea that neighborhoods are related to topography is strengthened with modern topographic information. The map in Figure 3B is the most recent survey of mound locations. When combined with mound dimensions measured back in the 1880s, the quantitative map patterns clearly show the differences between neighborhoods 1 and 2 and the transition zone between them.

Figure 4. Detailed elevation maps based on LiDAR data. These two maps are from the Master Plan for Iowa Blood Run (2015), but have been annotated for this discussion: A) general map of the Big Sioux River valley, and B) more detailed map focused on the four neighborhoods interpreted in the main mound group.
The two maps shown in Figure 4 are topographic maps based on elevations measured using a laser-based detection system (LiDAR). Landscape features such as bedrock outcrops, glacial end moraine, and river terraces are labeled on Figure 4A along with cultural features including villages outlined with dotted red lines and mound groups outlined with dotted black lines. Hill crests are marked with dashed red lines and high points are labeled with HP; these surround the village and mound complex and may all have significance in the ceremonial landscape that occupies the Big Sioux Valley. The Pitted Boulder and Sacred Spring are marked with a large and small black dot, respectively.
A more detailed version of the LiDAR topographic contours is shown in Figure 4B. Again, the Pitted Boulder and Sacred Spring are marked with black dots. Recall that the Pitted Boulder helped to define the line between Neighborhoods 2 and 3. Similarly, the dashed line along Blood Run Creek separates Neighborhoods 3 and 4. All three dashed lines trend to the southeast at right angles to the edge of the terrace and all three lines mark topographic breaks between the four neighborhoods. The orientations to the southeast and northwest are also seen in the river channel and linear hill slopes marked by doubled headed arrows. These southeast and northwest trends are also an important aspect of the overall ceremonial landscape.

Figure 5. Maps showing the size of mounds in Neighborhoods 1 and 2: A) Contour lines outlining areas with large mounds and small mounds, and B) Summary of mound sizes. Shurr, 2016.
Neighborhoods 1 and 2 can be distinguished on the pattern of mound size. The height and diameter of the mounds were surveyed by Lewis in the late 1880s and the relative size of the mounds can be compared by multiplying those two measurements. Figure 5A shows the resulting map of mound size. The lines with the 10,000 label enclose areas where mounds are large; lines labeled 1,000 show where smaller mounds are located. The patterns are easier to see in the simplified and colored version in Figure 5B. Smaller mounds are spread out along the terrace margin and there are two “blobs” of large mounds located in the “Southwest Area” and the “Northwest Area” separated by a “Transition Zone”. These numerically-defined areas correlate with Neighborhoods 1 and 2 recognized in the more generalized maps of mound distribution that we looked at earlier.
The main takeaway here is that the patterns in mound “neighborhoods” are very similar to landscape patterns like topography and stream channels. In addition to occupying the same location, the cultural and landscape patterns share specific orientations to the northeast and southeast. Everything seems to be related.
The next step will be to look at distribution of artifacts within the neighborhoods to see if the subdivisions based on mound distribution and size hold up in more detailed data. We’ll do that in the next post titled “Noisy Neighborhoods in the Silent City”.
Confession/Disclaimer
I’m a geologist by training and work experience and only an “avocational archaeologist” as they say. Also, as a retiree I’m unhampered by the need to generate the next grant or contract or to keep climbing the ladder toward promotion or tenure. That means that these are potentially fresh perspectives on relatively old scientific data, but probably lack the “credibility” associated with the voice of a professional archaeologist.
Sources in this article are only listed with a name and date. If you can’t Google it, email me and I’ll send you a complete reference.
This connection between the natural geologic features and the archeological evidence of the Oneota community are interesting and make a great deal of sense. I am not a geologist but I am a fan of Marcia Bjornerud who wrote Timefulness: How Thinking Like a Geologist Can Help Save the World; and she has had several wonderful essays in The New Yorker. I'm curious if this "Oneota" designation is related to the Oneota of upstate New York?