


Orientations and Alignments
"Seeing and Believing" at the Bridge Site

In our review of the archaeological sites on Lone Tree Farm we are now looking at another site that doesn’t have a formal designation and assigned “Smithsonian Number”. It’s adjacent to a relatively new bridge designed to resist flood damage by sacrificing the earth-filled approaches to preserve the steel and concrete bridge structure. The concern about this archaeological site was that reconstruction of a washed-out approach would probably impact the site if it became a borrow pit for the replacement construction.
However, there was a major flood event last year, the design worked well, and the “Bridge Site” was safe. The flood did complicate activities in the Archaeological Field School that was working on the site at the time of the flood event, but the staff and students from Augustana University got some major investigations done. Their work built on geophysical mapping of the site that had previously been identified as a probable ceremonial location by a Native American who is a keeper of traditional cultural knowledge.
Distinctive linear archaeological features are often called “alignments” and may refer to “orientations” that are similar to astronomical patterns like solstice and equinox sunrise or sunset or maybe constellations. However, the observed “orientations” may have other explanations based on geology rather than astronomy. There are big differences between “seeing or observing the compass orientations or trends” and “explaining or interpreting the origin of the alignment”. Archaeological “alignments” are interpretations that we believe to be true, while “orientations” are observations that we can actually see. The distinctions between observations and interpretations are often at the center of major disagreements in science and are currently on display in politics with the conflating of data and dogma. I’ve got some more thoughts on the differences between observations and interpretations in the last few paragraphs of this post

Figure 1----Location of five archaeological sites on Lone Tree Farm.
There are currently five archaeological sites identified on Lone Tree Farm (Figure 1). We looked at “Bar C” and “Cattle Trail” in the last post; neither one of them have formally designated Smithsonian Numbers. We’ve also described the “Circular Features Site” (21RK82) (although “Grass Circles Site” might be easier to remember?) and the “Oxbow Site” (21RK19) in earlier posts. The “Bridge Site” is located about a half mile downstream from the other four sites and has not yet been formally designated or assigned a Smithsonian Number. It’s considerably bigger than the other sites, but the outlined area may change during the process of site designation.
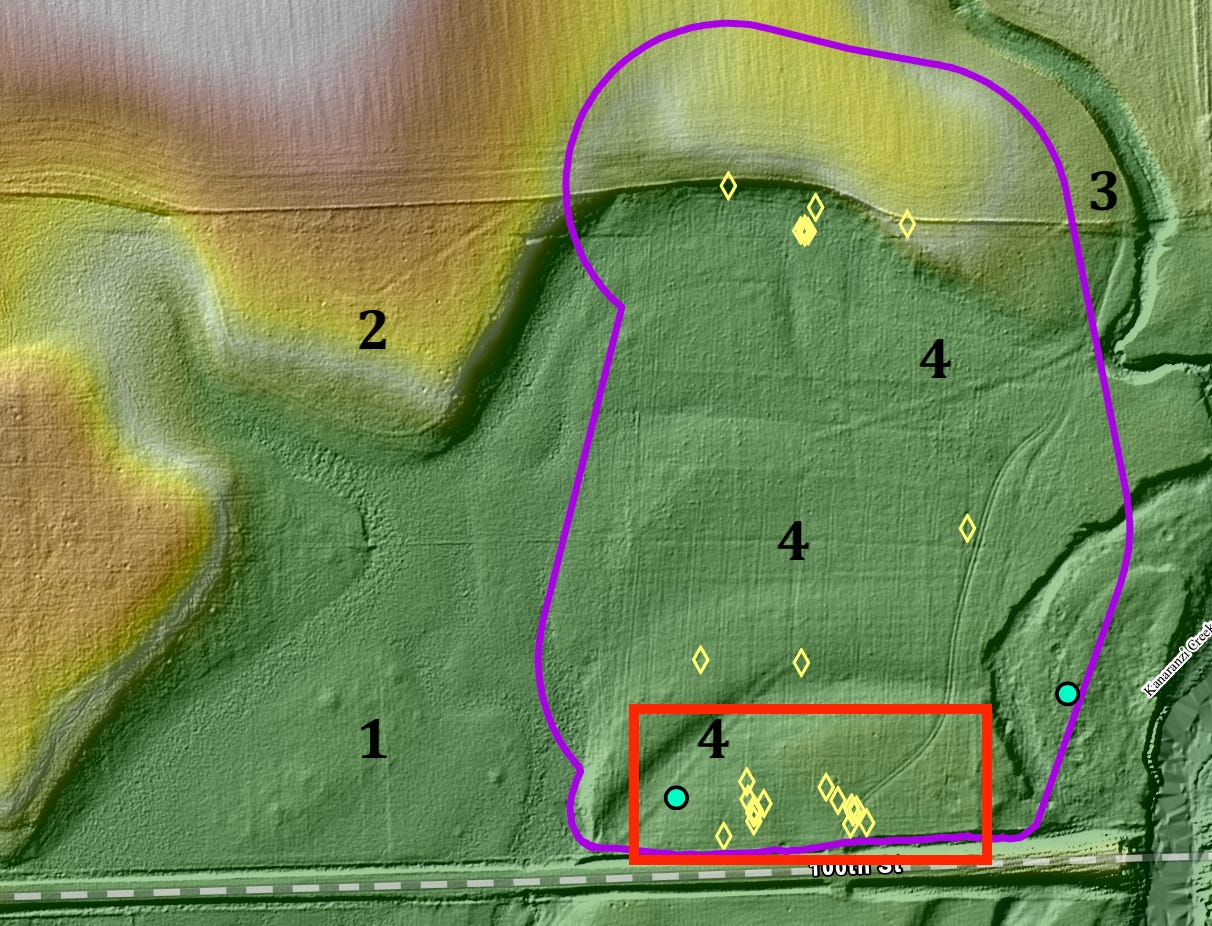
Figure 2----Map of detailed elevation with low places shown in green and flat uplands shown in yellow to white. This “LiDAR” image is computer-generated and is based on air-born instruments that use lasers to measure small differences in elevation.
The original focus of work on the Bridge Site is outlined in red on Figure 2. The small circles at the east end of the red box are slight depressions associated with circles in the grass that initially drew attention to this place. This is the area that the Native American identified as a ceremonial location and where we subsequently had a geophysical study done. The 2024 Augustana Field School also found surface artifacts at the yellow diamonds and did shovel tests at the light blue circles. A proposed outline for the Bridge Site is shown in purple. It includes not only the area of the red box, but also expands to incorporate specific locations to the north where artifacts were found at the surface.
However, there are number of other possible archaeological features located outside of the purple outline. The small circles to the west (1, Figure 2) are low mounds on a slight hill within a wetland. The two lines to the north (2, Figure 2) are probably the remnants of old fence lines, but could also possibly be archaeological features. A rock with possible cultural markings was recently found to the east (3, Figure 2). And, back within the proposed outline, the zig-zag line (4, Figure 2) may also be a possible cultural feature related to linear features documented within the red box. All of these locations require further evaluation.
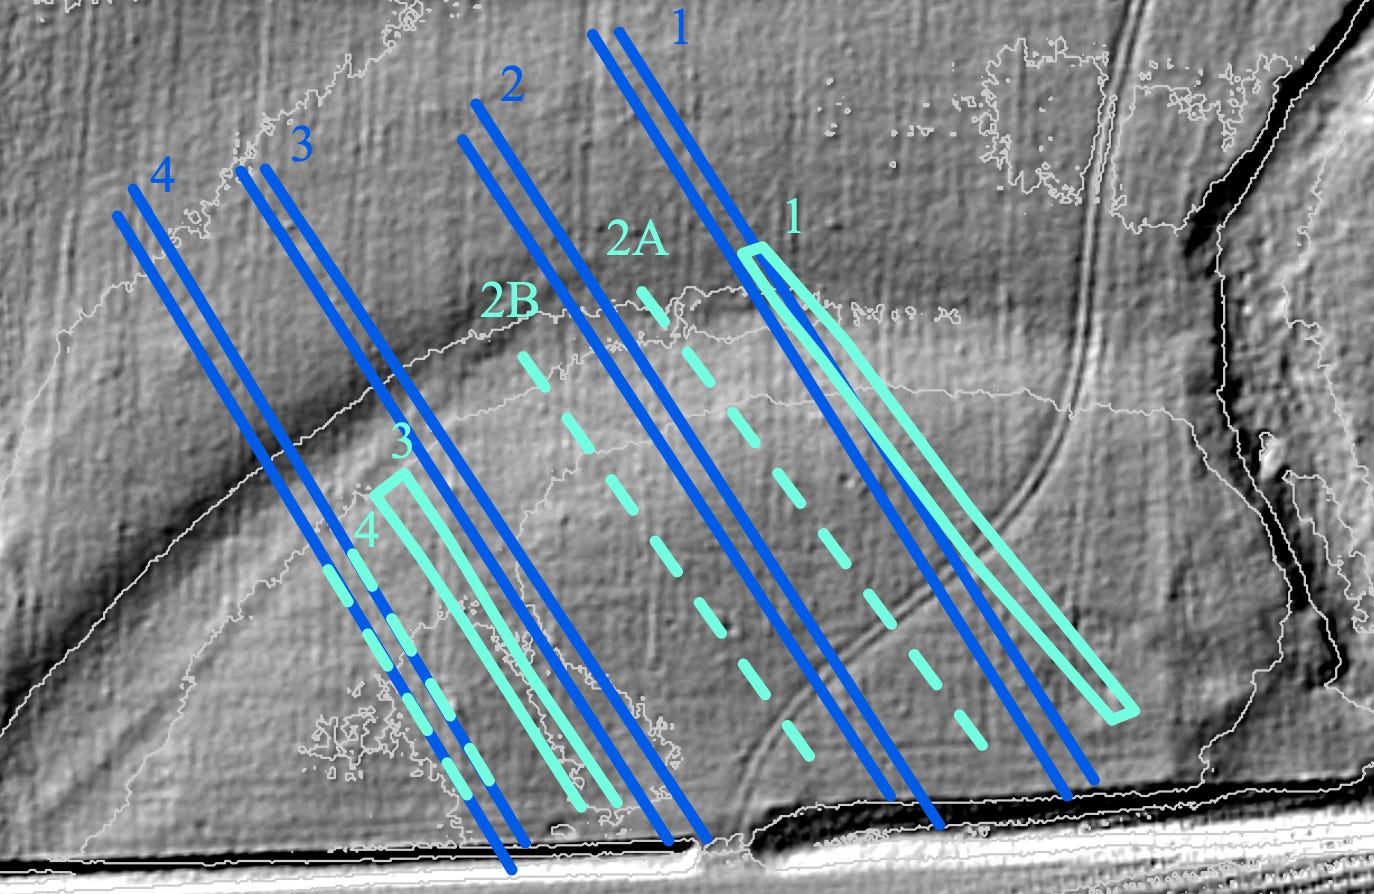
Figure 3----Linear zones observed on maps of LiDAR and gradiometer data at the Bridge Site.
Two independent data sets document four discreet linear zones (Figure 3) within the area outlined by the red box in Figure 2. Zones that show up on detailed elevation contours (another rendition of LiDAR data) are shown in light blue and zones that emerge from measurements of differences in soil magnetic properties (“Gradiometer”) are shown in dark blue. All of the zones trend to the southeast and there is a general correspondence among zones interpreted by several workers. Zone 1 was identified by the person who did the gradiometer study and also by the person who created the LiDAR contour map. Zone 3 was also interpreted by the gradiometer worker. I identified the rest of the zones based on the guidance provided by the other two workers. In addition, the zones also have expression on high-resolution arial photographs available from the county. The average orientation for these four zones is North 150 degrees East (N150E).
This discussion is a summary of information presented in an earlier post that also reviewed a possible origin for the lines. These features are similar to subtle, low linear mounds found at archeological sites in Iowa and North Dakota. But, recent descriptions of Native American rowed corn fields in archaeological sites in Wisconsin (McLeester, 2020) suggest another possible origin: maybe the southeast-trending zones are rows of corn hills? That would fit with the cache of corn cobs found at the Oxbow Site (21RK19). Although the cobs had contemporary radiocarbon dates, they also had a low-row count characteristic of primitive varieties. We’ve been advised by scientists familiar with the genetics of corn that there are no efficient genetic tests that could verify the ancient variety. However, maybe the cobs should be resubmitted for radiocarbon dating in light of the interpretation of possible ancient corn field rows?

Figure 4----Summary of compass orientations for linear patterns found in archaeological sites (Shurr, 2021). A) Twelve sites located in Minnesota, South Dakota, and Iowa. B) Good Earth/Blood Run.
The average compass orientation of N150E for the linear zones at the Bridge Site is approximately the same as the southeast trends (average of N145 E ) observed at dozen other well-documented sites in the region (Figure 4-A). Those same trends to the northeast and southeast are also observed for cultural features at Good Earth/Blood Run (Figure 4-B) where the orientations approximate astronomical alignments. That’s a common interpretation for alignments in archaeology. But, bedrock exposures near Good Earth/Blood Run also have fractures that trend in the same compass directions. So, the orientations observed in archaeological features may be related to patterns in the rocks as well as in the sky. Maybe there are geologic patterns near the Bridge Site that could “explain” the southeast trends? That’s a difference in the interpreted origins of the “alignments”, whereas the observed trends of all of the orientations are about the same.
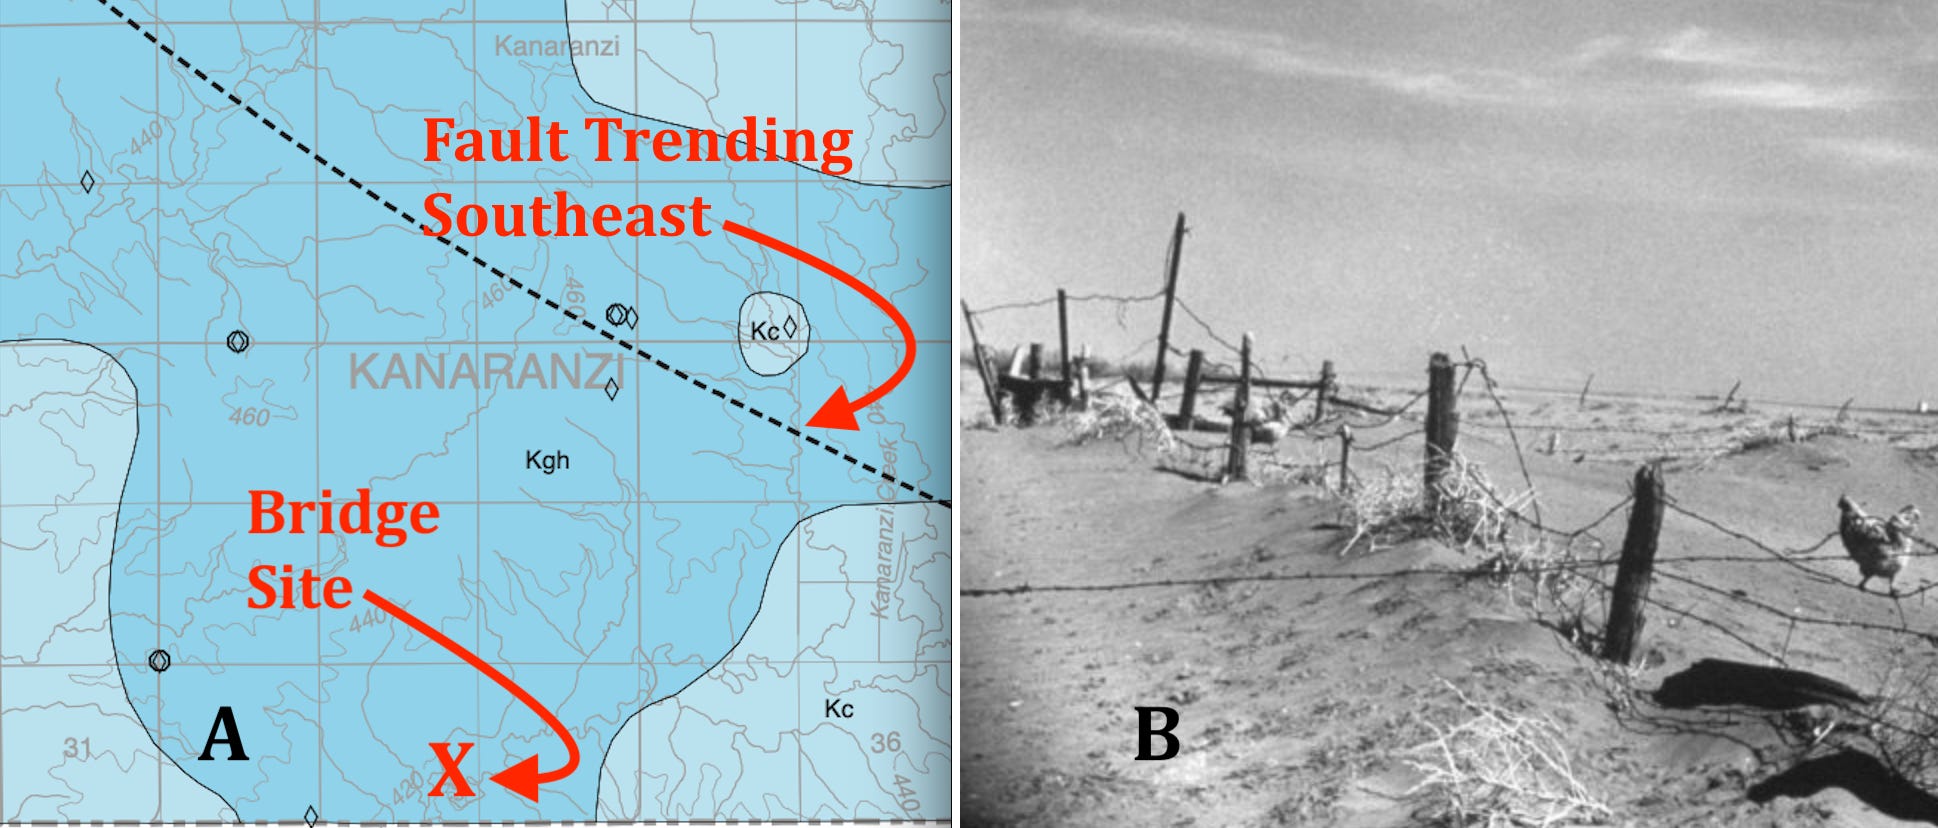
Figure 5----A) A buried fault is shown by the dashed line in this map bedrock geology (Jirsa and others, 2020). B) Wind-blown soil piled along a fence line during Dust Bowl days.
But wait! Maybe there are also some alternative explanations within the broad category of geologic ideas! Fractures and faulting often control the erosion and deposition of stream channels and valley landscapes. In fact, that’s an interpretation that’s generally accepted in the area around Good Earth/Blood Run. Although the possibility of fault and fracture control has not been discussed for the landscape around the Farm, there is a buried fault trending southeast that’s located three to four miles north of the Bridge Site (Figure 5-A). Maybe movement on that fault during the Ice Ages produced fractures in the glacial deposits to guide landscape trends observed by Native Americans?
Alternatively, there are published interpretations about landscapes in this whole region being sculptured by strong winds during the Ice Ages. Those strong winds are believed to have dominantly come from the northwest. The suggestion has been applied both to the erosion of gullies and to the deposition of “dunes” of wind-blown silt (also known as “loess”). Recent mapping of the surface geology in Rock County (Gowan, 2020) shows that loess covers the upland areas around the Farm, although no loess dunes have been identified. Maybe the northwest to southeast landscape trends replicated by Native Americans were produced by the Ice Age winds? The idea is illustrated by the piles of wind-blown soil that built up along fence lines during times of the modern Dust Bowl (Figure 5-B).
In any case, there’s a good reason to now look for linear landscape features, like gullies and segments of stream channels, in the vicinity of the Farm. Maybe there are southeast trends and also northeast trends? Maybe there are some northeast trends that can be observed in archaeological data? Maybe there’s still lots of science to be done in this area?
We’ve gone pretty far into the weeds with these detailed speculations about possible geologic origins for archaeological alignments at the Bridge Site. However, these are interpretations, as are the ideas about astronomical origins. The observations, however, are unequivocal: linear cultural features here and at other sites appear to match orientations that can be observed in the landscape. That in turn clearly indicates that Native Americans made, and continue to make, excellent observations about the surrounding environment.
Grateful Acknowledgement: My thanks again to Dr. Phyllis Johnson who directed the investigations conducted by Augustana University’s Archaeological Lab and Field School. Gabriela Jancikova created the maps under Dr. Johnson’s supervision. As always, if you want a complete citation for a publication referenced in this post, please contact me.
Political Postscript: I recently heard about a professional archaeologist who said that alignments are “notoriously contentious”. I think that he was probably talking about the interpretations based on astronomical origins and not about the simple observations of compass-trend orientations. The important distinction between interpretations and observations is illustrated by the suggestion of a geologic origin of some kind rather than the more conventional astronomical origin. That’s a difference in the interpretation of alignments; the observation of the orientations is a lot more straight forward and simple.
Unfortunately, many of the most acrimonious debates in science revolve around differences in interpretations. We fight more often about ideas that we think are true, rather than about the information or data that the ideas are based on. It’s even more unfortunate that this blurring of distinctions between observation and interpretation has carried over into the current political arena. The real world is not accurately described by an “either/or” dichotomy of interpretations. Functional interpretations are driven by data not by dogma.
Sorry for the soapbox! Happy Father’s Day!
I'm taken by the importance of the distinction between observation and interpretation, between data and dogma. Fascinating to consider the astronomical and geological interpretations for these ridges/mounds.